



Over the past months, we have implemented a large-scale tracker and analyzer for the blockchain developer ecosystem. Until now, we have found over 950 thousand repositories and 450 thousand developers across 26 ecosystems.
In this article, we will briefly summarize what the data is telling us, and answer some of the most common questions such as where developer activity is concentrated or what is the most common trend in developer activities.
If you do not agree with our observations, you can find our live dashboard here:
We also describe our methodology and limitations of the data, in case you want to learn more about the details.
BDR is currently in beta, and its coverage continues to expand. More than 100,000 repositories were added during the past two weeks alone. As new repositories are discovered, some historical figures may also be updated. Follow us for the latest dataset releases and analyses.
How many developers are in the ecosystem?
Interestingly enough, when we observe the number of active developers (i.e. committed at least once in the past 28 days) in the ecosystem, we see that the overall number did not decrease significantly over the past years.
Instead, since late 2024 numbers have remained around a stable baseline (about 25k) with some oscillations.
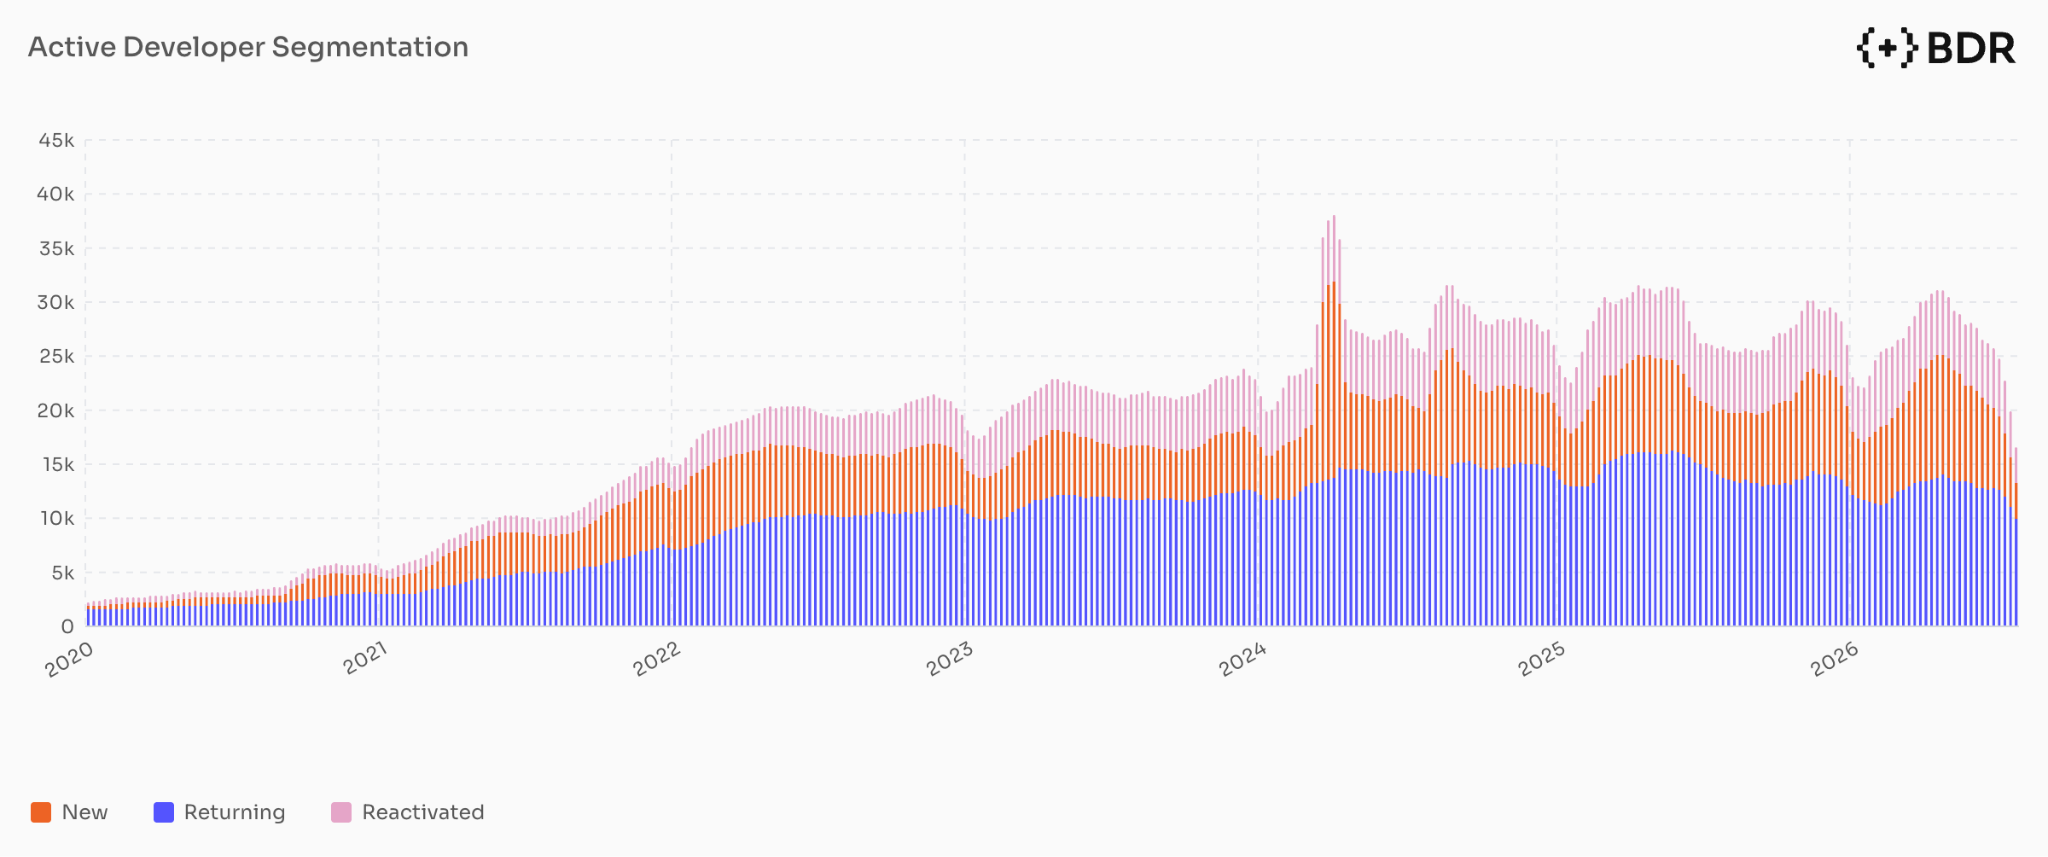
This graph is very encouraging since the common belief in the blockchain ecosystem is that the number of developers is mostly correlated to the token price. It is certain that the token price is not going very well over the past months, but the number of developers is remaining broadly stable. Can this mean the ecosystem is finally gaining resilience?
Other trends for active developers
Currently, the retention rate of developers is ~ 40%, meaning that 4 out of 10 of each developer remain active from the last month. This interpretation is also reflected in the churn shown below.
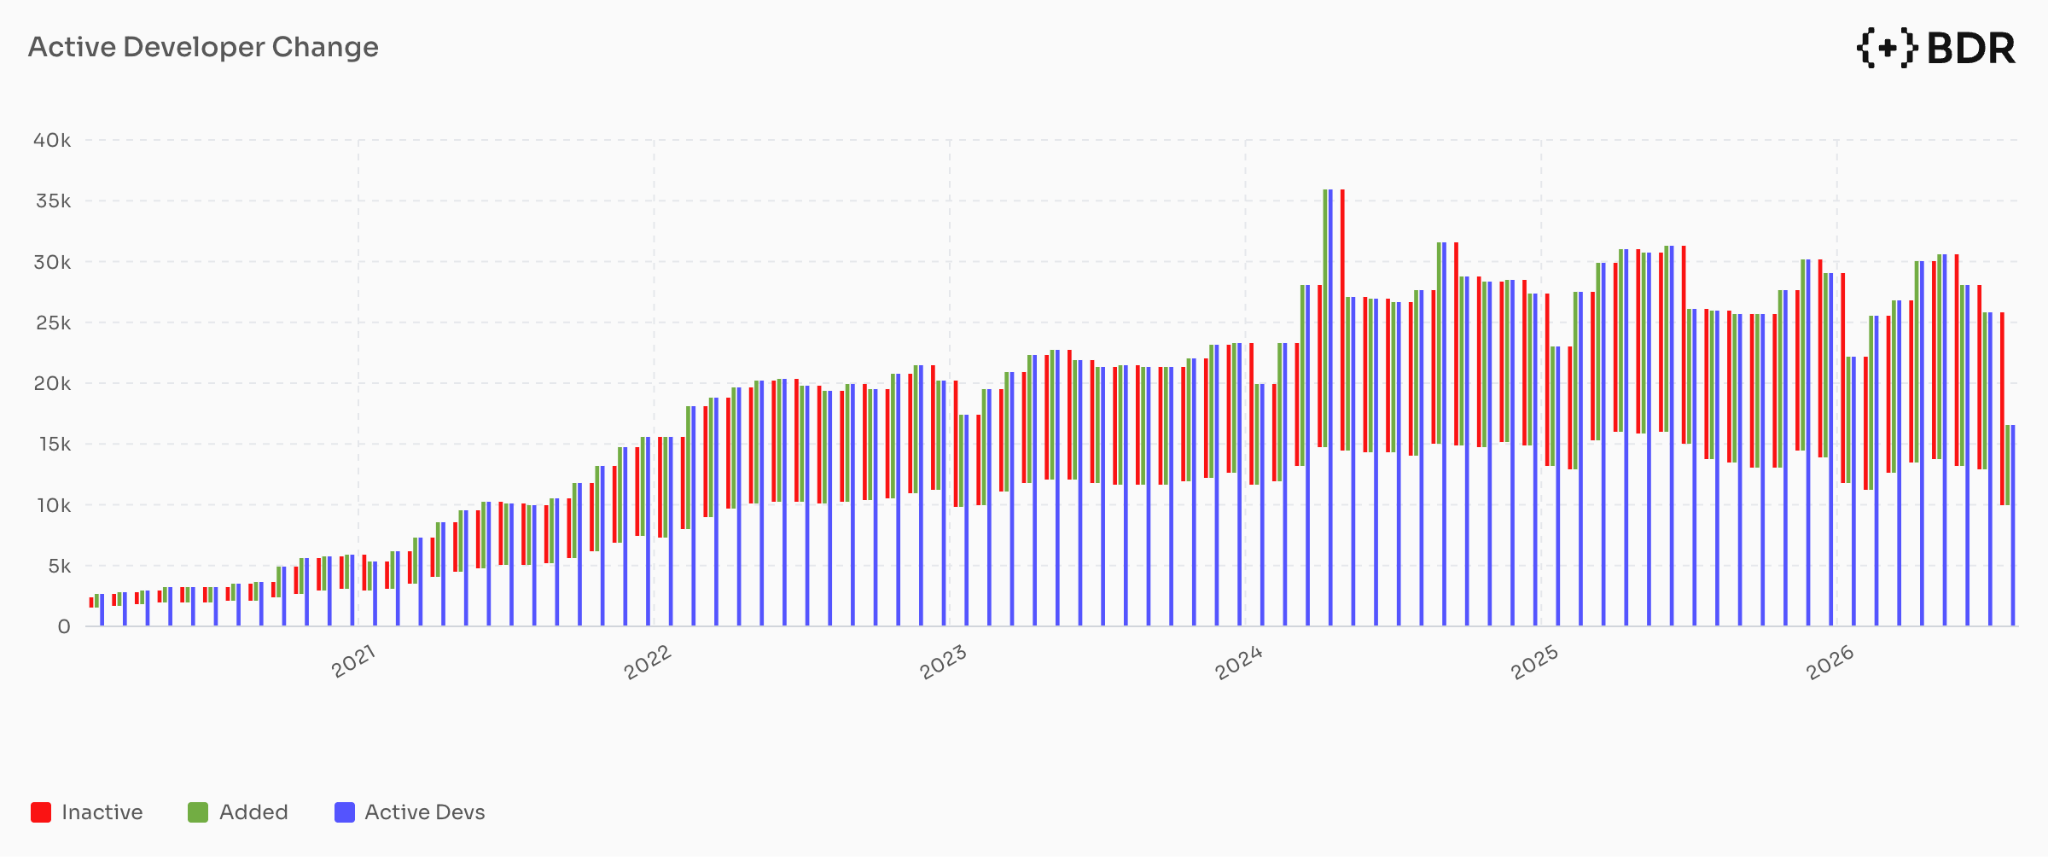
This figure suggests that even though the total number is not changing too much, fluctuations are quite high, and they are following a very similar trend for the past 2 years. This is a negative sign for maturity, showing that almost half of developers are working on blockchain for only around a month.
What does growth look like?
Another important point is the distribution of new developers joining the ecosystem.
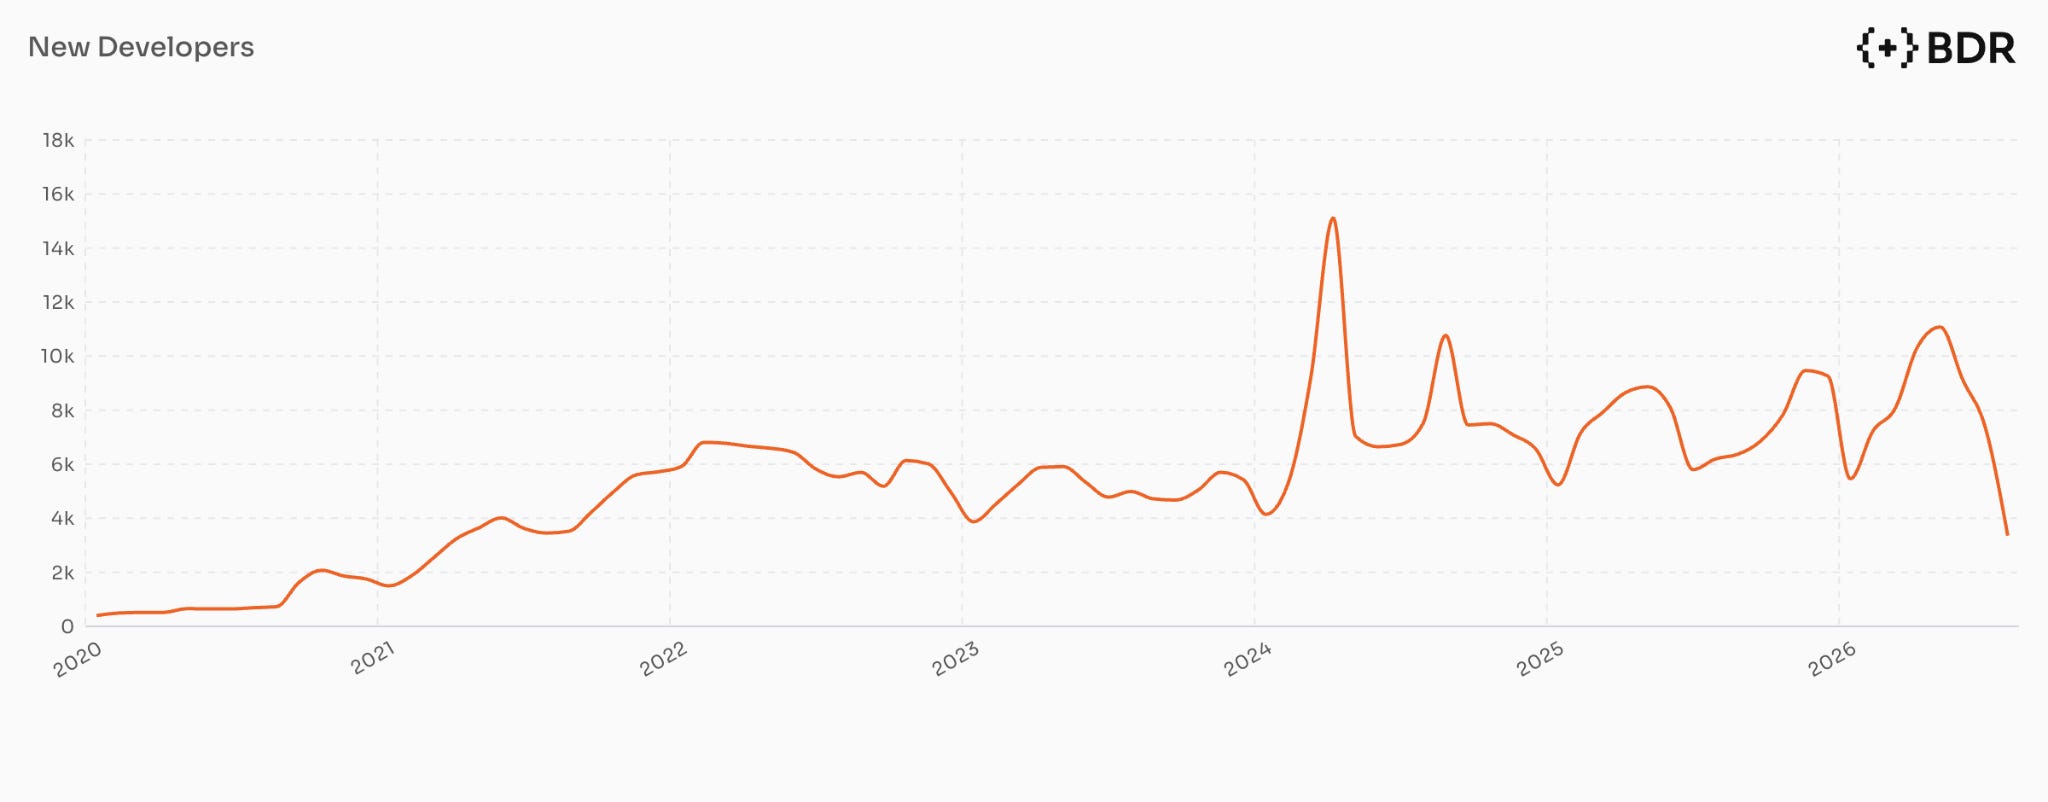
Here, a similar observation follows the previous. Even though the fluctuations are much stronger, new developer growth also seems to be keeping inside some boundaries, which is again very important for the maturity of the ecosystem.
Of course, a natural question that follows is which ecosystems are attracting the most new developers.
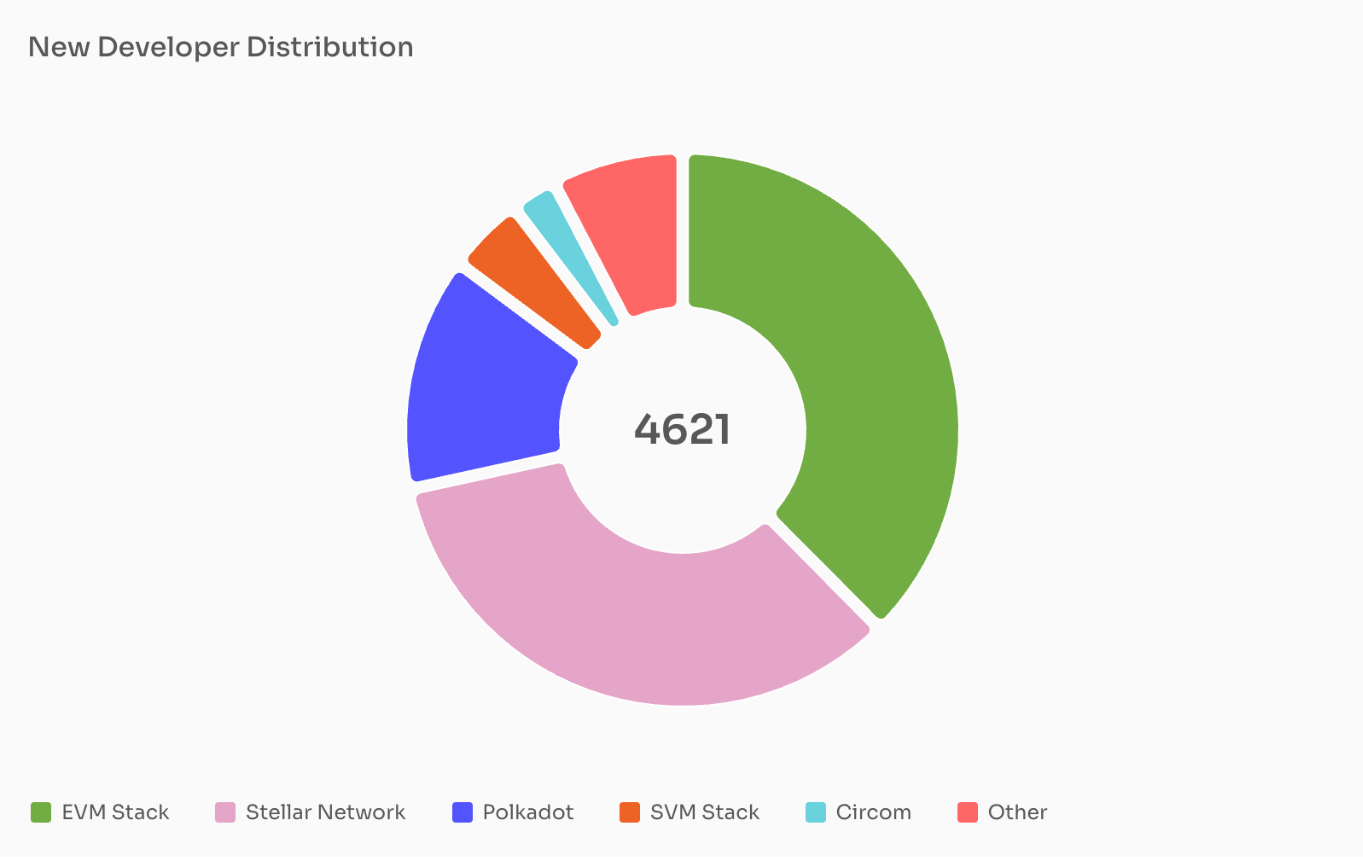
Probably not many would be surprised to see EVM in the first place, but it is peculiar enough that the two close followers, Stellar and Polkadot, are actually approaching EVM’s new-developer count. This is particularly interesting when you realize that Stellar is actually a substantially different stack than EVM and it is actually using a different programming language.
How about the distribution across ecosystems?
Coming back to the active developers of blockchain, it is important to answer how many developers are actually shared across ecosystems.
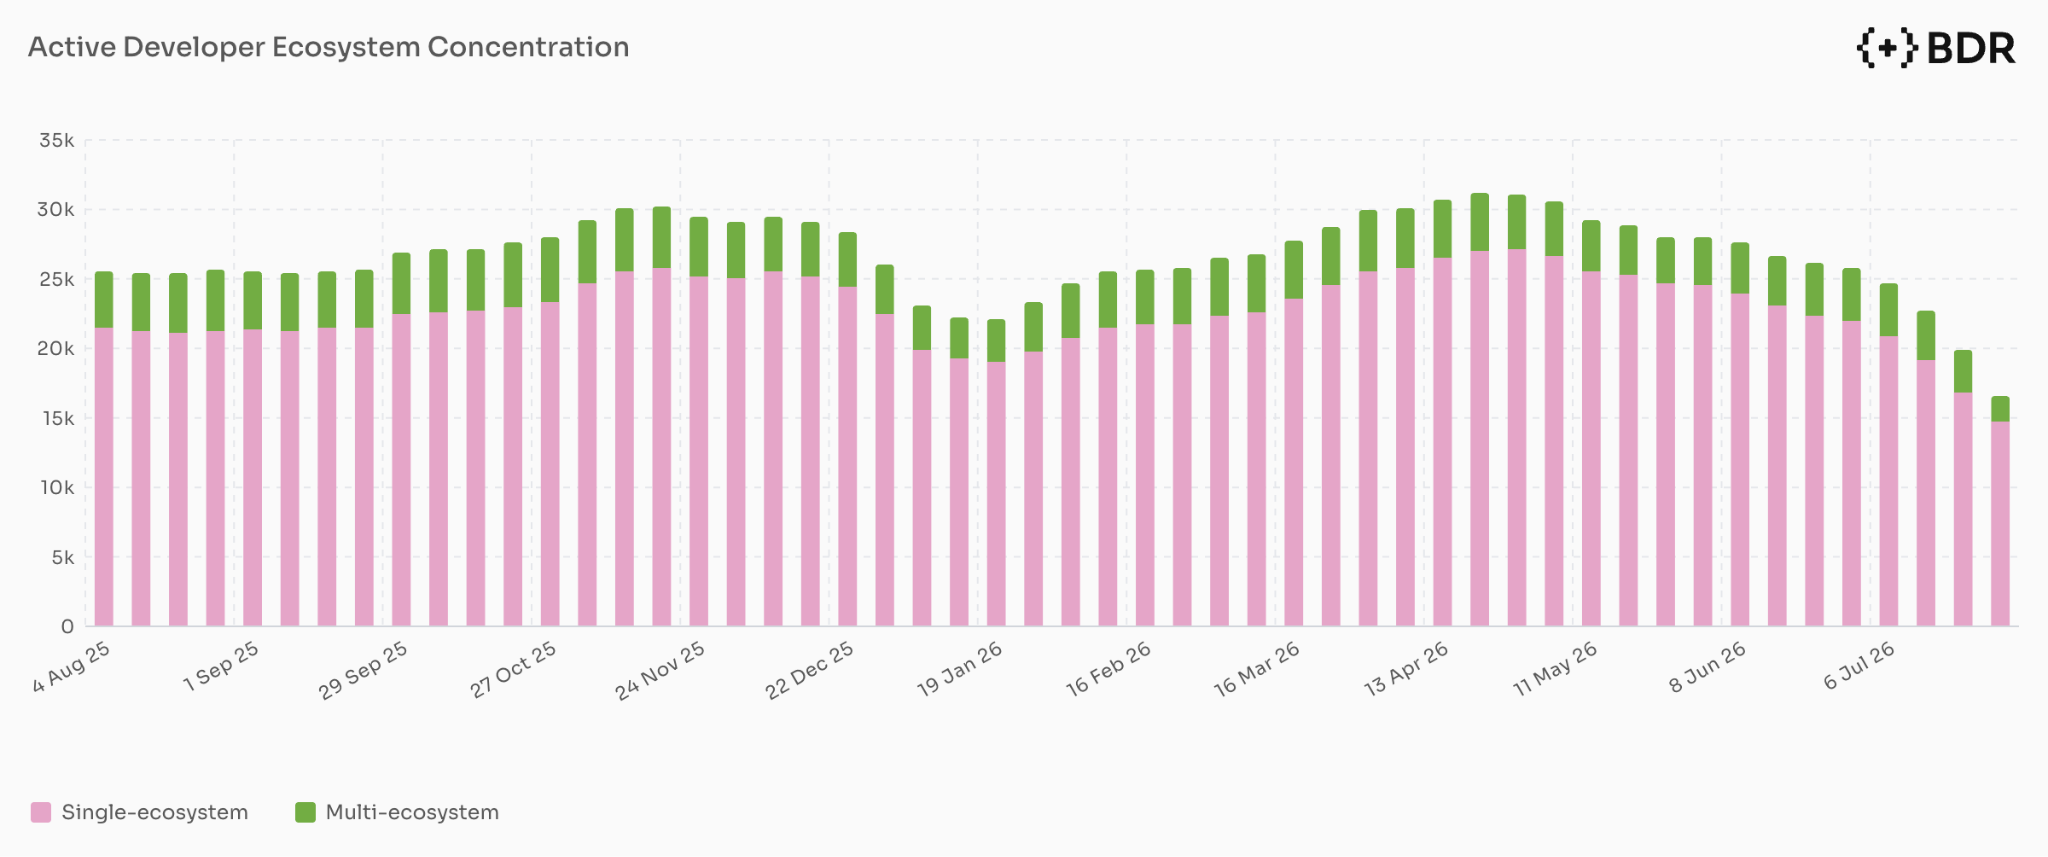
This final graph shows that it is not only the number of developers stabilizing, but also developers that are working on multiple ecosystems at the same time. This may not be as positive as before, since ideally we would like to see old developers working on new technologies as the time passes. Nevertheless, it is still reassuring to see that the number is at least not decreasing.
What’s next?
In this brief text, we have shared a few figures for the global data.
If you are looking to better understand individual ecosystems or developers, you can find more analyses and ecosystem specific dashboards in blockchaindeveloper.report.
Data is important; to analyze, understand and improve.
Now that we have analyzed and understood, what’s next is to improve.